Low income households struggle in many cities across the U.S. as home prices rise and housing inventory shrinks.
Low-income households are defined as those who make less than 80% of the local median income level. However, some low-income levels might be surprising. In San Francisco, for example, the low-income limit is registered as an annual salary of $105,350, the highest low-income limit in the U.S.
Now, Rent to Own Labs, a company that specializes in helping homebuyers find rent-to-own homes, conducted a study to see in which U.S. cities the U.S. Department of Housing and Urban Development is meeting the most housing needs.
To determine the effectiveness of a specific city’s housing program, Rent To Own Labs examined the most recent PHA and American Community Survey data from the U.S. Census Bureau found from HUD.
Recently, HUD Secretary Ben Carson went on a listening tour to determine what programs are working well and which ones need to be cut or modified.
However, six months in, the department has yet to make any significant changes. Some members of Congress are even beginning to grow inpatient, calling for decisions on issues such as the indefinite suspension of the FHA mortgage insurance premium cut.
Rent To Own Labs’ report found even in the best city for low income housing, there aren’t enough public housing units to house even half of the city’s low-income population.
Here are the top 10 best cities for low income housing, and the percentage of low income households the HUD programs can provide for:
10. Pensacola, Florida – 31.5%
Total low income households: 9,665
Total public housing units: 3,048
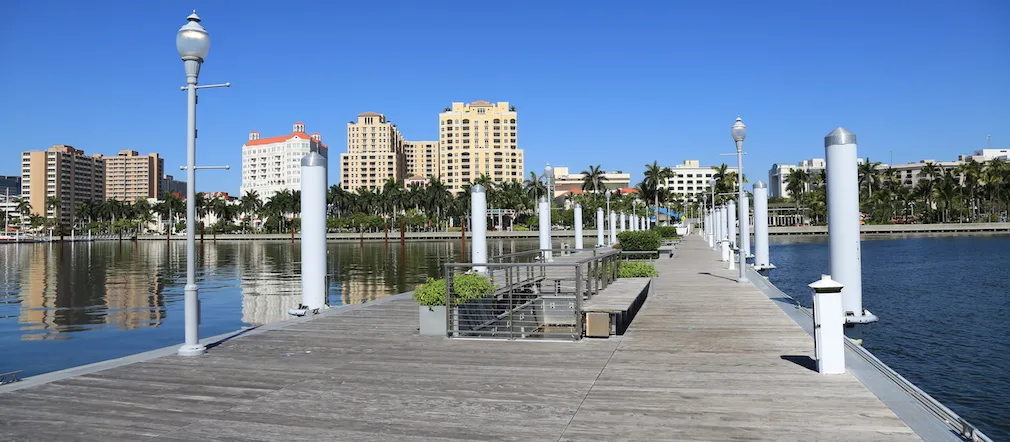
9. West Palm Beach, Florida – 31.8%
Total low income households: 21,195
Total public housing units: 6,737
8. Hoboken, New Jersey – 32.1%
Total low income households: 5,220
Total public housing units: 1,677
7. Albany, Oregon – 33.7%
Total low income households: 7,435
Total public housing units: 2,503
6. Spartanburg, South Carolina – 34.1%
Total low income households: 7,295
Total public housing units: 2,489
5. Cambridge, Massachusetts – 35.8%
Total low income households: 16,500
Total public housing units: 5,911
4. Monroe, Louisiana – 37.1%
Total low income households: 9,755
Total public housing units: 3,622
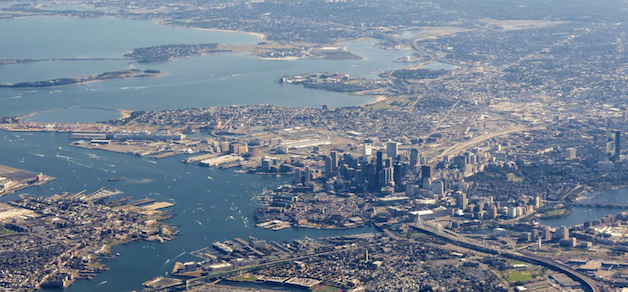
3. Boston, Massachusetts – 38.2%
Total low income households: 121,710
Total public housing units: 46,436
2. Texarkana, Texas – 43.5%
Total low income households: 5,975
Total public housing units: 2,598
1. Charleston, West Virginia – 45.1%
Total low income households: 9,210
Total public housing units: 4,158


